How to Install & Access Cockpit on CentOS 8

Managing and Administering Linux Servers is a daunting task for every System Administrators. It needs an essential hands-on experience in command line/ CUI. However, many significant projects are coming up to handle Linux Administration tasks via the web console. It helps the new system admins, DevOps, and Developers to handle the system administration task easier. In the current scenario, the Cockpit project leads one of the most top positions in RHEL, CentOS, Fedora, Ubuntu, Debian, and many others.
The cockpit is an open-source project owns by Redhat. By using this web-based interface, we can access single or multiple (local, remote, and cluster) servers simultaneously. It permits users to easily manage the server configuration and also monitor the GNU based Linux Servers without having a hands-on exposure in command line/CUI. Each action in the console will be translated into the Linux command. However, a Terminal is also embedded in the Cockpit console. If it is required, we can switch to the command-line interface. Due to the complexity of the project, the Cockpit has formed a small community of active members, and the main contributors are especially from Red Hat even though it is an opensource.
The Cockpit project is implemented for a standalone usage with no client-server architecture on it. Normal system credentials can be used to log-in to the Cockpit Web Console. The cockpit can be deployed on top of the ( above listed) Operating System and access it directly from the client’s browser. We can even use the local deployed Cockpit to troubleshoot, configure and monitor to all the remote systems, for that we need to install the Cockpit packages on each remote Linux instance.
This step by step guide will help you how to install and configure the Cockpit on RHEL/CentOS 8 Operating Systems. For other distros, it may come with a small type of difference in using it. Therefore, it is highly recommended to read the guidelines before deploying the same.
Prerequisites:
Operating System : CentOS Linux 7 /8
User account     : root user or user account with sudo privileges
Recommended to run all the administrative command as with sudo privilege instead of root.
Difficulties to setup sudo users? Click here to find the steps.
First, let’s update the system to the latest version
$sudo dnf update -y
Step 1: Install and enable Cockpit
Note:
By default, Cockpit packages will be installed on all the CentOS 8 versions, in case if it is not, then as the first step, use the following command to install the package
$ sudo dnf install cockpit
Use the following command to enable and start the Cockpit socket service.
$ sudo systemctl enable cockpit.socket
$ sudo systemctl start cockpit.socket
Now, we need to enable the firewall ports of the Cockpit service. However, by default, the firewall ports are activated in CentOS-8. If you want, you can disable the firewall service. But we always advise enabling the firewall service, as it will be the first layer protection of your servers. In our demo, we will use the firewall service. To know more about firewalld configuration command, click here to see the step by step guide.
$ sudo firewall-cmd — add-service=cockpit — permanent
$ sudo firewall-cmd — reload
Finally, use the following command to check and confirm whether the Cockpit service is up and running.
$ sudo systemctl status cockpit.socket
Output:
● cockpit.socket - Cockpit Web Service Socket
   Loaded: loaded (/usr/lib/systemd/system/cockpit.socket; enabled; vendor pres>
   Active: active (listening) since Sun 2020-07-26 13:00:08 IST; 33min ago
   Docs: man:cockpit-ws(8)
   Listen: [::]:9090 (Stream)
   Tasks: 0 (limit: 11348)
   Memory: 1.5M
   CGroup: /system.slice/cockpit.socket
Now, we have successfully installed the Cockpit Socket Service on CentOS 8 with the above steps. Now follow the steps to access the Cockpit service via Web console.
Step 2: Access Cockpit Service via Web Console
To access the Cockpit, open your browser and enter the following URL, which is the server IP address or hostname followed with port number 9090.
To access from a local server (use localhost or local IP address or hostname):
To access from the remote server (use remote server IP address or hostname or domain name):
https://IPADRESS:9090 OR https://domain.com:9090)
For the first time, when you try to access the Cockpit service via browser, you will be notified of a warning message as your connection is not secure. This is due to the self-signed certificated used by the Cockpit service. However, we can override this by selecting the ‘Advance option and click ‘proceed or exception’ the IP address. Once the connection is established without any warning/error message. Then you will be redirected to the Cockpit Web Console Login as highlighted from the below screenshot.


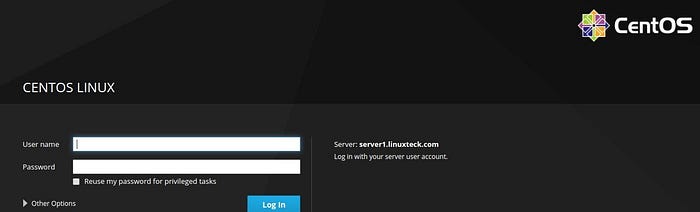
To log in to the Cockpit Web Interface you can use either the server root credentials or create a new user with admin privileges. In our demo, we are going with root credentials. To configure a new user with admin rights, click here to find the steps. After sign-in into the Cockpit console, you will see the following Cockpit Dashboard screen.

In the above screen, you can see a list of features on the left panel of the dashboard in the Cockpit Web Administration. It can be used for administrative tasks such as monitoring and configuration. Let’s have a look at each one of them.
2–1 System :
In the System feature, we can see an overview of the system details like the “ the realtime performance graph for CPU, Memory, Disk I/O and Network Traffic. Also, we can see the Information about the system hardware details, OS name with software update features, hostname, system time, and power options like shutdown/restart.

2–2 Logs :
In this option, we can find the log details of our entire system, however, we have a choice to separate the logs based on the severity. To make a separation, click the drop-down box and select based on your needs.

2–3 Storage :
In this option, we can review, manage and configure the storage method on our system like disk partitions, create volume groups, create raid, import iscsi, mount NFS (Network File System), etc. Also, we can get the realtime details about disk I/O and log details of the storage box.

2–4 Networking :
In this screen, we can find all the network-related services. By using this service we can modify the current network interfaces and create NIC Bonding, bridges, and VLANs. And also, we can configure firewall settings and view network logs.

2.5 Podman Containers :
In this screen, we can add/manage podman containers.

2.6 Accounts :
We can use this feature to create new users or modify/view the existing users’ accounts on the system. Also, we have a section to add the SSH keys for users to access the remote system with the combination of key pairs.

2.7 Services :
On this screen, we can view all the running system-related services on the server. And also we can manage those services like start/stop and add/remove.

2.8 Applications :
In this screen, we can view and manage (add/delete) all the installed extensions.

2.9 Diagnostics Reports :
Using this screen, we can generate reports for analysis. This report provides the collection of log files on the system.

2.10 Kernel Dump :
From this screen, we can see the status of the KDump service and the path of the dump file location. Also, we have an option to test the configuration, but do not test this option in your production server.

2.11 SELinux :
In this screen, we can enable and disable the enforced SELinux Policy and see any alerts generate related to SELinux.

2.12 Software Updates :
On this screen, we can see if any software packages are available to update on the system and it can be installed from this screen.

2.13 Terminal :
As the name mentioned terminal, we can execute all the Linux related commands (CUI).

Step3: Connect Multiple Servers
The Cockpit permits users to access multiple servers from a single console, but it requires an additional package to be installed on the system. Use the following command to install this additional package to connect multiple servers to the Cockpit dashboard.
$ sudo dnf install cockpit-dashboard
Output:Dependencies resolved.
================================================================================
 Package                 Architecture Version             Repository       Size
================================================================================
Installing:
 cockpit-dashboard       noarch       211.3-1.el8         AppStream       225 kTransaction Summary
================================================================================
Install  1 PackageTotal download size: 225 k
Installed size: 172 k
Is this ok [y/N]: y
Once you have finished the installation of new package (cockpit-dashboard), then log-out of Cockpit, after you login in back to Cockpit console, you can find the dashboard will appear as shown below:

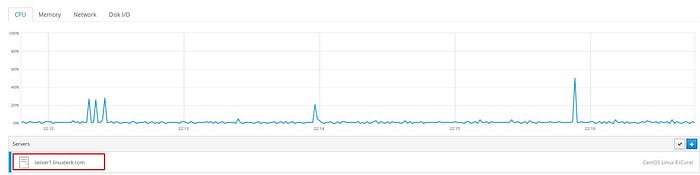
When you click the ‘dashboard’ option, you will get a screen where it shows the performance graph and the list of the existing connected system. In our demo, you can see only one server is connected.
To add a remote instance in the Cockpit, we need to click the plus (+) sign as highlighted in the following screen, then enter the IP address or hostname or domain name of the instance and select a particular color that can be easily identified. Finally, click the ‘Add’ button. For CentOS 7 and the lower version needs the Cockpit package to be installed before adding the instances into the Cockpit dashboard.


Without installing the Cockpit package on CentOS/RHEL 7 or lower versions turn the following error while trying adding into the Cockpit Web console.

Now we can see all the newly added servers list in the Cockpit Dashboard. Also, it displays the graphs with different colors representing the performance of each server from the list.

The instances can be switched between the Cockpit dashboard by clicking the drop-down list as highlighted from the following screen.

Step4: Enable Stored Metrics
By default, Cockpit does not store any performance-related data in the cockpit database, rather it shows the live graph of CPU, Memory & Swap, Disk I/O, and networking usage. If we want to store these metric data, then we have to install this feature by just simply click on the Enable Stored Metrics as highlighted in the below screen.

Once you have clicked this option, a small popup box will open and request to install the cockpit-PCP packages. Once the package has been installed, we can enable this Stored Metrics option as highlighted below:

That’s it! In the next session, we will see the Cockpit administration step by step guide with examples.
Thank you! I hope this article will help you to understand how to install the Cockpit service and the features. Drop me your feedback/comments. If you like this article, kindly share it and it may help others as well.
Originally published at https://www.linuxteck.com/how-to-install-cockpit-on-centos-8/ on August 3, 2020.
